Evaporation
Evaporation records from pans are frequently used to estimate evaporation from lakes and reservoirs and ET from an area. Since information about monthly coefficients is not available in India, these coefficients are decided using the analogy of spatial variation from arid and humid regions to the conditions that prevail in India during winter and summer months. During the transition months, the ambient temperature and the pan temperature are considered to be the same. Also, as it is generally observed that a factor of 0.7 is accepted the world over as the coefficient on an annual basis, the monthly variation has to be plus or minus the value of the annual coefficient. According to these considerations, the monthly coefficients can be adopted as 0.6 in cold dry winter months, 0.8 in hot summer months and 0.7 in the transition months between the winter and the summer and the vice-versa. For this purpose, the parallel of 22° latitude has been taken as the demarcating line.
Variation of Pan Coefficient values with month
|
Location |
Coefficient |
||
|
0.6 |
0.7 |
0.8 |
|
|
North of 22° latitude |
November-February |
March-April and September-October |
May-August |
|
South of 22° latitude |
December-January |
February-March and September-November |
May-August |
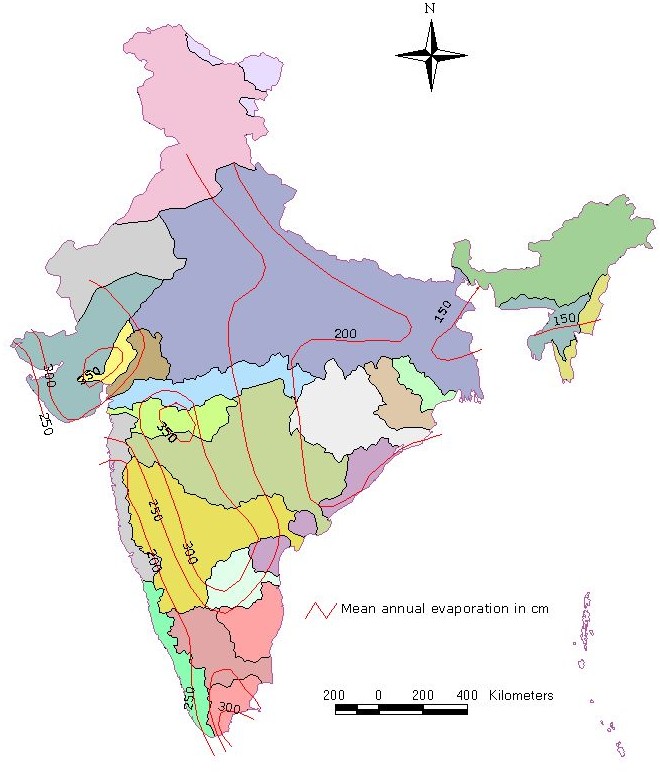
Evaporation Maps
Evaporation rates closely follow climatic seasons, and reach their peak in the summer months of April and May. The central areas of the country display the highest evaporation rates during this period. With the onset of monsoon, there is a marked fall in the rate of evaporation. The annual potential evaporation ranges from 150 to 250 cm over most parts of the country. Monthly potential evaporation over the peninsula increases from 15 cm in December to 40 cm in May. In the North-East, it varies from 6 cm in December to 20 cm in May. It rises to 40 cm in June in West Rajasthan. After the onset of monsoon, evaporation decreases all over the country.
India Meteorological Department has published monthly and annual mean evaporation values of 30 stations in India.
Typical features of evaporation for various months
|
Month/season |
Evaporation variation over the country |
|
January |
Evaporation is highest (16 cm) over Saurashtra- Kutch. It is about 14 cm at Jalgaon in Maharashtra and Raichur -Bellary in North interior Karnataka. It is 8 to 10 cm over Rajasthan and Peninsular India, 6 cm over Uttar Pradesh and Bihar and less than 6 cm over Assam. |
|
February |
There is an increase in evaporation by 2 cm over previous month. The increase is 4 cm in Saurashtra- Kutch and Jalgaon and 6 cm over Raichur -Bellary. |
|
March |
The pattern is similar to January and February. Evaporation is 27 to 29 cm over Saurashtra-Kutch, Jalgaon and Raichur-Bellary. Over Rajasthan it varies from 15 cm to 20 cm and around 15 cm in Uttar Pradesh. Evaporation is less than 10 cm over Assam. |
|
April |
There is an overall increase in evaporation by 8 to 10 cm over the previous month. |
|
May |
Evaporation is the highest in this month. It varies from 12 cm over Assam to 50 cm over Jalgaon. Over Kota and Saurashtra-Kutch it is 40 cm. In north India, it varies from 20 to 35 cm. Gaya with its characteristic semi-arid climate is isolated with 35 cm. In the Peninsula it varies from 15 to 35 cm. Over Assam it is less than 15 cm. |
|
June |
The distribution pattern is similar to May. However, values of evaporation are slightly less than those in May. |
|
July |
There is appreciable fall in the evaporation as compared to the June values. Isolated pockets of 25 cm over Rajasthan and Bellary -Raichur region are noticed. Near Kovilpatti in Tirunalveli district in Tamil Nadu, the evaporation is more than 30 cm. It varies from 10 to 25 cm in the peninsula and 12 to 25 cm in north India including North-east. |
|
August |
The evaporation varies from 10 cm in Assam and west coast to 20 cm in Rajasthan and central parts of the Peninsula. |
|
September |
Over Saurashtra-Kutch, Bellary -Raichur region and the Kovilpatti area the evaporation is 20 cm and rest of India it varies from 10 to 16 cm. Over Assam, it is less than 10 cm. |
|
October |
The pattern is similar to September. However, with reduced evaporation by 2 to 5 cm through out the country. |
|
November |
The evaporation has decreased further and excepting for pockets over Saurashtra-Kutch, Jalgaon, Bellary-Raichur and Kovilpatti where it is 15 cm. Evaporation varies from 10 to 12 cm over Peninsula and 5 to 10 cm in North India and less than 5 cm in Assam. |
|
December |
The evaporation pattern is similar to January with high pockets (12-14 cm) over Saurashtra-Kutch, Jalgaon and Raichur -Bellary. In other parts it is around 6 to 10 cm. |
|
Monsoon (June-October) |
The pattern generally resembles those observed during the months of July, August and September. Evaporation over West-coast and Assam is less than 60 cm. It is more than 100 cm over Rajasthan and adjoining areas of Gujarat, Madhya Pradesh, and parts of Haryana and Uttar Pradesh. Isolated pockets of high evaporation could be seen around Kovilpatti in Tamil Nadu and Bellary -Raichur in Karnataka. |
|
Non-monsoon (November-May) |
The pattern very much resembles the monsoon. Evaporation is less than 100 cm over West-coast, East-coast and Assam and is around 125 cm over Rajasthan and adjoining areas. It is more than 100 cm around Kovilpatti in Tamil Nadu. Isolated pockets of high evaporation of 150 cm are seen around Jalgaon in Maharashtra and Bellary. |
|
Annual |
As is to be expected, the pattern is broadly similar to the monthly distribution, with centres of high evaporation over Saurashtra-Kutch, Jalgaon and Kovilpatti in Tamil Nadu. It is lowest, 100 cm over Assam. The 200 cm isoline covers a narrow strip of north-south tract from Punjab to Karnataka through Rajasthan and Maharashtra. Parts of Uttar Pradesh and Bihar States have evaporation ranging from 150 to 200 cm. |