River Water Quality
Increase in population,
urbanization and industrialization is causing an ever-increasing threat to the
quality of waters in rivers, lakes and ponds in
|
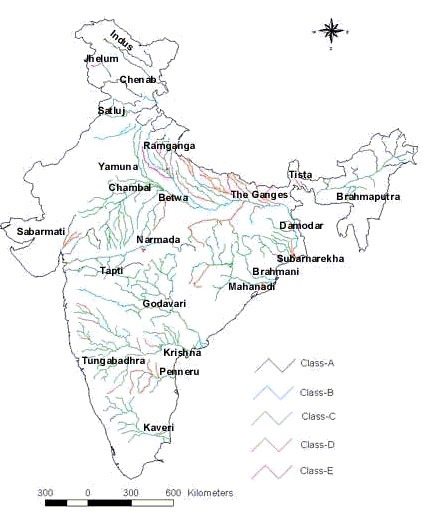
Class A: River water fit for drinking after proper disinfection with the addition of chlorine or bleaching powder. |
Class B: This water is fit for bathing. |
|
Class C: Water fit for drinking only after proper treatment (screening to remove physical matters or particulate such as paper, plastic, etc. |
Class D: This is fit for fish and wildlife. |
|
Class E: Suitable only for industrial cooling, irrigation, etc. | |
(Source : www.edugreen.teri.res.in)
Average Chemical Composition (ppm) of Some Indian Rivers
|
River |
HCO3 |
Cl |
S04 |
SiO2 |
Ca |
Mg |
Na |
K |
TDS |
|
|
56 |
11 |
4 |
7 |
14 |
5 |
7 |
3 |
107 |
|
Cauvery |
135 |
20 |
13 |
23 |
21 |
9 |
43 |
4 |
272 |
|
|
128 |
10 |
11 |
18 |
25 |
8 |
11 |
3 |
241 |
|
|
105 |
17 |
8 |
10 |
22 |
5 |
12 |
3 |
181 |
|
Gomti |
274 |
9 |
15 |
15 |
30 |
19 |
27 |
5 |
394 |
|
|
64 |
5 |
23 |
5 |
54 |
12 |
10 |
0.3 |
173 |
|
|
178 |
38 |
49 |
24 |
29 |
8 |
30 |
2 |
360 |
|
|
122 |
23 |
3 |
17 |
24 |
13 |
14 |
8 |
224 |
|
|
225 |
20 |
5 |
9 |
14 |
20 |
27 |
2 |
322 |
|
Tapi |
150 |
65 |
1 |
16 |
19 |
22 |
48 |
3 |
322 |
Water pollution varies in severity
from one region to the other, depending on the density of urban development,
agricultural and industrial practices, and the systems for collecting and
treating wastewater. The Central Pollution Control Board (CPCB),
Some Polluted River Stretches in
|
River |
Polluted
stretch |
Desired class |
Existing class |
Critical parameters
|
Possible source of
pollution |
|
Chambal |
Downstream of Nagda and downstream of |
C |
D/E |
BOD,
DO |
Domestic and industrial
waste from Nagda and |
|
Damodar |
Downstream of Dhanbad |
C |
D/E |
BOD,
Toxicity |
Industrial wastes from
Dhanbad, |
|
|
Downstream of
|
C |
D/E |
BOD |
Wastes from sugar
industries, distilleries and food processing
industries |
|
Gomti |
|
C |
D/E |
DO, BOD, Coliform |
Industrial wastes from
distilleries and domestic wastes from |
|
Hindon |
|
C |
D |
DO, BOD,
Toxicity |
Industrial and domestic
wastes from |
|
Kali |
Downstream of Modinagar to confluence with |
C |
D/E |
BOD, Coliform |
Industrial and domestic
wastes from Modinagar |
|
|
Karad
to Sangli |
C |
D/E |
BOD |
Wastes from sugar
industries and distilleries |
|
Sabarmati |
Immediate upstream of
Ahmedabad up to Sabarmati Ashram |
B
|
E |
DO, BOD, Coliform |
Domestic and industrial
waste from Ahmedabad |
|
Sabarmati Ashram to Vautha |
D |
E |
DO, BOD, Coliform |
Domestic and industrial
waste from Ahmedabad | |
|
Satluj |
Downstream of
|
C |
D/E |
DO,
BOD |
Industrial wastes from
hosieries, tanneries, electro-plating and engineering industries and
domestic waste from |
|
Downstream of Nangal |
C |
D/E |
Ammonia |
Wastes from fertilizer
and chloralkali mills from Nangal | |
|
Subarnarekha |
Hatia
dam to Bharagora |
C |
D/E |
-do- |
Domestic and industrial
waste from |
|
Yamuna |
|
C |
D/E |
DO, BOD, Coliform |
Domestic and industrial
wastes from |
|
In the city limits of
|
B |
D/E |
DO, BOD, Coliform |
Domestic and
industrial wastes from |
a BOD (biochemical oxygen demand), DO (dissolved oxygen). Source: CPCB